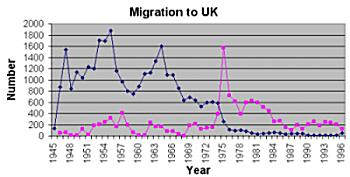
Migration to the UK: Post-war periodThe number of migrants leaving for the UK after the second World War between 1946 and 1996 was 31,489. This makes the UK the second largest receiving country after Australia. Peak levels were reached in 1947 ( 1536), 1955 ( 1872) and 1964 (1597). After that, the number of migrants leaving for the UK decreased slowly at first and more rapidly after 1975. Return migration from UK over this period of 50 years amounted to 12, 969. The most significant period of return migration was again reached in 1975, with a peak of 1572 migrants returning. After that the level of returned migrants returned high ( at around 400-600 per year) until 1984, after which it declined to below 200 returnees pa. 
Migration to and from the UK 1946-1996 (Bottom line refers to number of returning migrants) Migration Statistics YEAR | Emigrants | Returning | 1945 | 138 | 0 | 1946 | 870 | 54 | 1947 | 1536 | 58 | 1948 | 845 | 14 | 1949 | 1137 | 15 | 1950 | 1038 | 121 | 1951 | 1234 | 24 | 1952 | 1200 | 180 | 1953 | 1702 | 205 | 1954 | 1690 | 249 | 1955 | 1872 | 315 | 1956 | 1161 | 164 | 1957 | 960 | 408 | 1958 | 805 | 193 | 1959 | 745 | 58 | 1960 | 878 | 11 | 1961 | 1112 | 8 | 1962 | 1129 | 237 | 1963 | 1332 | 162 | 1964 | 1597 | 160 | 1965 | 1092 | 77 | 1966 | 1092 | 77 | 1967 | 856 | 35 | 1968 | 638 | 4 | 1969 | 683 | 181 | 1970 | 640 | 216 | 1971 | 527 | 123 | 1972 | 597 | 148 | 1973 | 603 | 154 | 1974 | 581 | 393 | 1975 | 254 | 1572 | 1976 | 113 | 721 | 1977 | 97 | 615 | 1978 | 100 | 394 | 1979 | 82 | 598 | 1980 | 48 | 622 | 1981 | 30 | 591 | 1982 | 46 | 509 | 1983 | 49 | 446 | 1984 | 65 | 253 | 1985 | 47 | 271 | 1986 | 26 | 149 | 1987 | 43 | 100 | 1988 | 43 | 195 | 1989 | 43 | 121 | 1990 | 10 | 201 | 1991 | 9 | 259 | 1992 | 12 | 188 | 1993 | 10 | 249 | 1994 | 9 | 233 | 1995 | 10 | 204 | 1996 | 53 | 124 | Total | 31489 | 12659 |
| | |
The following table gives comparative figures for the various countries. It is seen that return migration for the UK was the highest of all major host countries, being twice as high as that from Australia, Canada or the US. This is perhaps explained to some extent on the basis of proximity to the mother land. It also emphasizes the fact that migrants to the UK are often different in various ways from those to other countries. Summary of Migration changes 1946 - 1996 Country | To | From | Net Migration | Return % | Australia | 86787 | 17847 | 68940 | 21.56 | Canada | 19792 | 4798 | 14997 | 24.24 | UK | 31489 | 12659 | 18830 | 40.20 | US | 11601 | 2580 | 9021 | 22.24 | Other | 1647 | 907 | 740 | 55.07 | Total | 155060 | 39087 | 115973 | 25.21 |
| | | | |
    
| 

![]() .
.