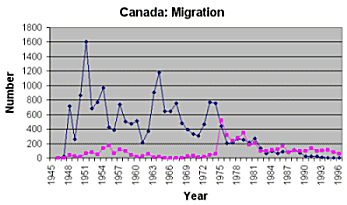
Migration to Canada: Post-war periodThe Number of migrants leaving for Canada after the second World War between 1946 and 1996 was 19,792. Peak levels were reached in 1951 (1607 migrants) and again in 1964 (1181 migrants) Return migration from Canada over this period of 50 years, amounted to 4798 migrants. The most significant period for return migration was from 1975 to 1981, when the number of migrants was as high as 517 (in 1975), and stayed over 200 level for the next five years. 
Migration to and from Canada 1946-1996 (Bottom line refers to number of returning migrants) Migration To and From Canada, 1946 - 1996 YEAR | To Canada | Return | 1945 | 0 | 0 | 1946 | 3 | 0 | 1947 | 27 | 0 | 1948 | 719 | 42 | 1949 | 258 | 22 | 1950 | 863 | 15 | 1951 | 1607 | 65 | 1952 | 680 | 78 | 1953 | 770 | 48 | 1954 | 963 | 135 | 1955 | 425 | 169 | 1956 | 383 | 64 | 1957 | 739 | 119 | 1958 | 505 | 93 | 1959 | 471 | 38 | 1960 | 509 | 12 | 1961 | 213 | 21 | 1962 | 371 | 52 | 1963 | 905 | 9 | 1964 | 1181 | 18 | 1965 | 648 | 2 | 1966 | 648 | 2 | 1967 | 752 | 0 | 1968 | 478 | 0 | 1969 | 394 | 26 | 1970 | 332 | 33 | 1971 | 308 | 6 | 1972 | 467 | 14 | 1973 | 768 | 39 | 1974 | 755 | 57 | 1975 | 441 | 517 | 1976 | 202 | 318 | 1977 | 213 | 238 | 1978 | 269 | 279 | 1979 | 248 | 347 | 1980 | 213 | 178 | 1981 | 271 | 203 | 1982 | 135 | 94 | 1983 | 66 | 98 | 1984 | 91 | 112 | 1985 | 64 | 120 | 1986 | 88 | 165 | 1987 | 79 | 78 | 1988 | 108 | 103 | 1989 | 74 | 97 | 1990 | 27 | 98 | 1991 | 23 | 130 | 1992 | 24 | 97 | 1993 | 8 | 106 | 1994 | 3 | 108 | 1995 | 3 | 81 | 1996 | 0 | 52 | Total | 19792 | 4798 |
| | |
The following table shows the relative number of migrants to other countries, in comparison with Canada. It can be seen that Australia comes second as the country most favoured by Maltese migrants: 12.76 % of migrants went to Canada. It is also seen that the proportion of return migration to the total migrant populatoin is also one of the lowest, at 24 %. In other words, about one-fourth of those to left for Canada went back to Malta. This rate is second only to migration to Australia, where return migration was only 21 %. By contast, return migration from the US was the highest, at 78% of Summary of Migration changes 1946 - 1996 Country | To | From | Net Migration | Return % | Australia | 86787 | 17847 | 68940 | 21.56 | Canada | 19792 | 4798 | 14997 | 24.24 | UK | 31489 | 12659 | 18830 | 40.20 | US | 11601 | 2580 | 9021 | 22.24 | Other | 1647 | 907 | 740 | 55.07 | Total | 155060 | 39087 | 115973 | 25.21 |
| | | | |
    
| 

![]() .
.