7.4 The Migrant Contribution: Remittances by Maltese MigrantsIn Chapter 1, reference was made to the role that the migrant has played in controlling the size of the population in the Maltese Islands. The contribution of Maltese migrants to the social structure and economy of the Maltese Islands was examined. It was emphasised there that the massive migrant efflux reduced the need for infra-structural development, housing, education etc by maintaining a largely static population. During the period 1950-1980 migration was the most important single factor controlling population growth. In this section the more direct contribution to the Maltese economy by migrants is analysed. Data was obtained from the National Accounts of the Maltese Islands, and the Central Office of Statistics to remittances received in Malta since 1954. The main kinds of remittances include the following: - Personal remittances, which include most types of remittances sent by migrants to persons living in Malta (relatives, friends, etc)
- Other transfers include gifts, dowries, and inher-itances
- Pensions, which include all pension income transferred to Maltese persons. These include ex-servicemen pensions with the British forces as well as pensions of retired migrants.
Total Remittances 1954-1997Over the period 1954-1997 a total of 648.8 million Lm have been received by Maltese living in Malta from these sources. Prior to 1964 the level of remittances was constant at around lm Lm annually. However, thereafter there was a rapid rise reaching a maximum of 44m in 1988. Since then the level has dropped to around 20 m annually (fig 7.1). 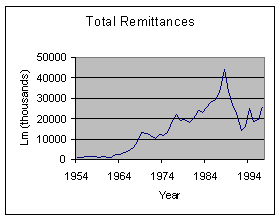
Figure 7.1 - Total remittances 1954-1997. Note the increase from around 1m Lm per annum to a level of over 40m Lm in 1988. Remittances fell to around 20Lm annually since then. The breakdown of remittances into the various components is shown in figure 7.2. Personal remittances make 38% of all remittances, pensions 33% and other remittances 29%. 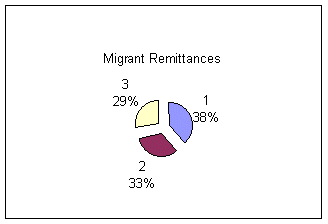
Figure 7.2 - Break-down of remittances, by source. 1 = personal transfers, 2 = pensions, 3 = other transfers. Personal TransfersDuring the period 1954-1997 a total of 245,733,000 Lm were transferred to Malta as personal transfers. As can be seen from figure 7.3, personal remittances increased slowly from around 1m Lm annually in the early 1950s to reach a peak of 13m Lm in 1977. A second peak of 16m Lm was reached in 1989. Since then the level of personal remittances has levelled at around 3-4m Lm annually. 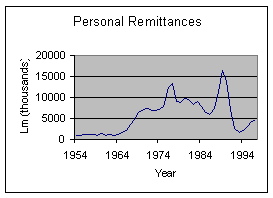
Figuse 7.3 - Personal remittances sent by migrants over the years, since 1954. Between 1969 and 1991 the levels were invariably greater than 6m Lm per annum. There was a marked drop in 1992 to around 2.5 Lm, and has since remained at around the level of 4m Lm per annum. Other Migrant TransfersThis category accounts for 29% of all transfers and over this period of time amounted to 184,539,000 Lm. The level of these transfers rose from under 100,000 Lm annually in the 1950s to reach a maximum of 24m Lm in 1988. Since then the level has fluctuated around the 5m Lm mark annually. 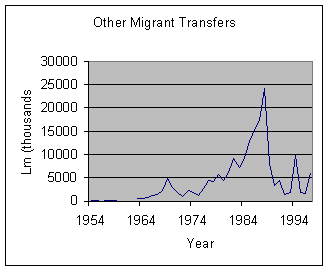
Figure 7.4 - Other Migrant Transfers, which include gifts, dowries, inheritances by persons in Malta from overseas sources. Note the massive rise to 24m Lm in 1988. They now fluctuate around the 5m Lm mark per annum. PensionsThe contribution from pensions is quite significant, making up 33% of total remittances, and the cumulative total since 1963 amounts to 216m Lm. As seen from figure 7.5, there has been a continuous rise in the total remittances from pensions over the years. In contrast to other contributions also, there does not appear to be an evidence of reduction over recent years. In fact one would assume that this component will continue to rise in years to come due to indexing of pensions, and as a result of more pensioners deciding to retire in Malta. While it is fair to add that the bulk of these pensions relate to pensions to ex-servicemen who formerly served with the British forces, they include also a sizeable amount from the ever-increasing number of migrants who choose to retire in Malta, and who bring with them their pensions from overseas. 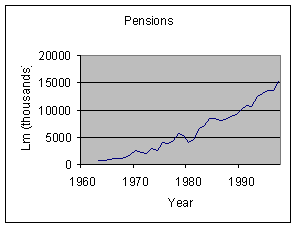
Figure 7.5 - Remitances from Pensions. There has been a continuous rise with no sign of abatement since the mid-1960s. It now amounts to around 15m Lm annually. Remittances as a proportion of GDP and Current Government Expenditure It is of interest also to compare these remittances with standard bench-marks of the Maltese economy. For this purpose the Current Government expenditure as well as the Gross Domestic Product (GDP) was obtained (from the 'National Accounts of the Maltese Islands', and the 'Economic Survey' for the respective years). As seen for the figure7.6 below, remittances as a proportion of the GDP rose steadily from the early 1950s to reach a peak of 16% in 1970. Over the period 1964 to 1989 they were at or above the 5 per cent level. They are currently around 1.6% 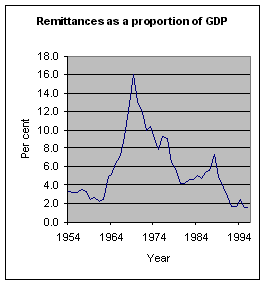
Perhaps more significant is the comparison between remittances and the Current Government expenditure for the successive years. Figure 7.7 shows that for most of the time since 1954 and until as late as 1990, remittances amounted to over 20 percent of the total Current Government Expenditure. For a period of time in the mid 1960s, remittances were more than half of the Current Government expenditure, and in fact they were almost equivalent in 1969. 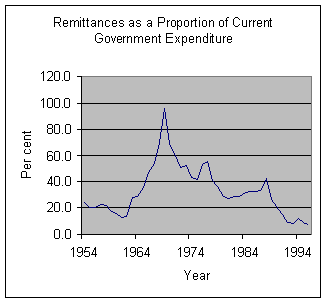
Finally, it has to be pointed out that while the above documents the available information relating to remittances received by persons in Malta, it in no way covers all the monetary contributions made by migrants over the years. Suffice it to say that migrants still prefer Malta for a holiday, they fly Malta airlines, they take longer holidays than most other "tourists" so that for each migrant the average stay is more likely to be measured in months rather than days. A criterion such as "tourist-weeks" would be far more informative than the current count of tourist heads which serves as an indicator of tourist activity. However this information is not currently available. Migrants, moreover, very often hire cars for prolonged periods, and often need accommodation. They spend money on food and other goods. None of these items are currently available for analysis and assessment. Perhaps a prospective survey could be initiated to study these various aspects associated with visiting Maltese migrants. Source: Maurice N.Cauchi - The Maltese Migrant Experience, Malta 1999
    
| 

![]() .
.