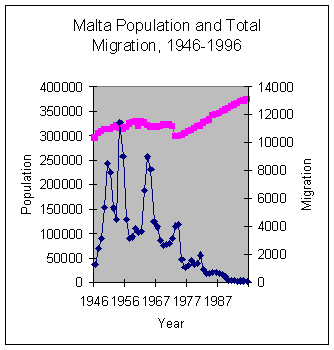
1.2 Half a century of Migration: 1946 - 1996The history of Maltese migration is unique in a number of ways Its effects on demography as well as the economy of these Islands have been quite profound. While the major waves of migration have long since dampened down, their after-effects are still being felt all around us. There is still considerable confusion about migration statistics. Some have felt the need to exaggerate and distort the actual situation. Many have mixed up the contribution from the first generation migrants with second and subsequent generation. An examination of the Demographic Reports for 1946 till 1996 show a number of interesting facts relating to migration and return migration from the various countries that have benefited from receiving our migrants. Over this half century, a total of 155 thousand persons left these Islands. This means that a population equivalent to 44% of the Maltese population left these Islands to live overseas. A considerable number of these (39 thousand, or one in every four) returned, resulting in a net post-war migration outflow of just under 116 thousand persons. The migration exodus started to become significant soon after World War II and already by 1946 the number of migrants leaving Malta exceeded 1000 every year. A look at figure 1.2 shows that peaks of migration occurred in 1950 (8503 migrants), 1954 (11,447 migrants), 1964 (8987 migrants), with another minor peak in 1982 (966 migrants). In between these peaks there where troughs with lower migration activity. After 1974, there was a sharp and continuous downward trend so that by 1983 there were less than 1000 migrants leaving the country every year, and by 1990, less than 200 migrants annually. 
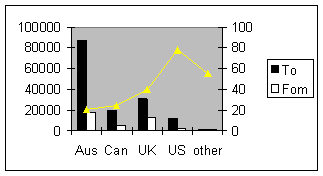
Figure 1.2 - Number of migrants leaving Malta (1946- 1996). Note also the increase in the total Maltese population (upper graph) which reached its lowest point in 1974, and has been increasing linearly ever since. Where did they go to?As illustrated in figure 1.3, the majority of post-war migrants chose Australia as their destination (87,000, or 56 per cent of the total). Another 32 thousand (20 per cent) left for the UK, and 20 thousand (13%) for Canada, with the US bringing the tail with just over 11.6 thousand (8%). 
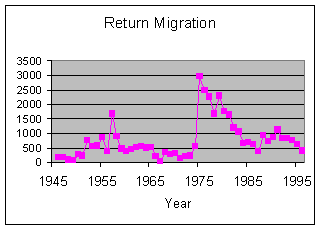
Figure 1.3 - Showing distribution of migrants in the various host countries. Figure also shows the number of returning migrant. The line indicates the proportion of migrants returning from each country. Return MigrationReturn migration was always an intrinsic part of the migration programme. Overall, one in four migrants came back. Over this period of time, a total of 39 thousand migrants returned home, (sometimes to re-emigrate some time later on). The graph (fig 1.3) shows that migration from the main host countries is very variable, being least for Australia (21 per cent) and highest for the US (78 per cent). Analysis of the return migration curve shows that there were three peaks of migration return (Fig 1.4) Firstly, in 1952, the number of returning migrants rose above 1000 per annum (from a background level of less than 500 annually). It remained high for the next four years. A second peak occurred in 1975. This was a sudden rise from a very low background return rate of a few hundred a year (around 200-500) to reach nearly 3000. Return migration remained high (above the 1000 pa mark) until 1983. Over this 9-year period the number of returning migrants was over the 1000 pa mark. After this time the level dropped but remained relatively high (over 500 pa). A final minor peak occurred in 1991 when 1124 returned. Since then the numbers have continued their downward trend , reaching 399 in 1996. The factors which determine which migrants decide to return to Malta have never been studied in any depth. Maybe the distance and expense involved in going to Australia were determining factors in ensuring that there is minimum return migration from there. Certainly one can point out that the elections of 1987 and 1992 had hardly any significant effect on the pattern of return migration One has heard several comments about the fact that in more recent years there appears to be a deluge of migrants returning from overseas. One senses that there is a paranoid apprehension that their return might somehow disturb our established way of life in Malta. 
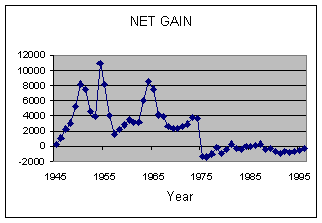
Figure 1.4 - Return migration over the years - Note peaks in 1957 (when 1671 migrants returned), and 1975 (when a sudden rise to 2957 occurred). A minor peak occurred in 1991. Net migration 'gain'Migration impinges directly on rates of population growth in Malta. From this point of view, what matters is the 'net gain', namely, the difference between the number that leave and the number that return in any particular year. The data demonstrate that over the past 50 years, there has been a considerable positive balance, with migration exceeding return migration by several thousand a year (see figure 1.5) 
Figure 1.5- Net migration (i.e. Total migrants less returned migrants per year) Yet when one examines the net migration curve we see certain considerable fluctuations over the years (Figure 1.5). In 1975, there was a precipitate drop, so that for the first time in our migration history, the number of migrants returning was higher than those leaving these shores To note, however, that the magnitude of this "negative gain" was minimal, compared to the previous positive net migration gain. Since then, the inflow and outflow of migrants have just about cancelled each other out, so that one could say that migration has ceased to be a significant factor in population control of these Islands since 1980s. Migration to and From AustraliaAs mentioned already, Australia was the destination of the largest number of Maltese migrants. A total of 86,787 left Malta for Australia over the 50 year period 1946-1996. This efflux was not however a continuous or smooth one. As seen from the graph (Fig: 1.6) there were years when migration topped the 10,000 mark, and this was preceded and followed by deep troughs . After the mid-1970s, migration to Australia became a mere trickle. Return migration was also a marked feature but was relatively less marked than return migration from other countries (see above). A total of 17,847 migrants returned from Australia over this period: this translates to 20.6 per cent of the total number of migrants to Australia. The largest exodus from Australia was in the five-year period 1976 - 1981, during which time a total of 6373 migrants returned. This is equivalent to 35.7 per cent of all returned migrants from Australia! Population growth of the Maltese Islands: The Migrant ContributionA look at figure 1.7 shows that the population of the Maltese Islands has been growing at a steady rate over the past half century, rising from 295 thousand in 1946 to 374 thousand in 1996. It would have been far different if migration on such gigantic scale (relative to the size of the Islands) did not occur. A superimposition of the "net gain" on top of the population curve shows that had migration not occurred, the population in Malta today would have topped the half-million. That migration has been a crucial method of population control in Malta is without doubt. This 'safety valve' has been particularly valuable at a time of a high birth rate and dismal economic conditions at home. The fact that it has been effective is attested to by the fact that as soon as migration ceased to be a significant features, the population of the Maltese Islands started to climb. A near-zero migration level is one of the most significant factors in relation to this issue Without emigration, and particularly at a time of high birth rate, the rate of climb would have been much higher. One must remember, moreover, that these migrants would have populated the earth at the same rate as their compatriots. The number of persons belonging to the second generation in Australia is currently slightly larger than the first generation. On this assumption, one could say, as an educated and conservative guess, that without migration, the population of Malta would have reached today the staggering figure of over 600,000. This is the figure one arrives at if we were to include first and second generation migrants now in Australia to the current population of Malta. It is an underestimate in the sense that Australia is only one, albeit the most significant country where Maltese migrants have settled. I have always been impressed with the contribution that migrants have made to their native country. From these figures it would appear that the greatest contribution they have made is not so much in terms of the financial assistance they contributed to their families in the early days, or more recently, from their frequent and long holidays in Malta, but far more significantly, they have contributed by their absence, which effectively constituted the most effective means of population control in these Islands. [From: The Sunday Times, 12 October, 1998, p 19-20] Source: Maurice N.Cauchi - The Maltese Migrant Experience, Malta 1999
    
| 

![]() .
.